Imports System.Drawing
Imports System.Math
Imports System.Data
Public Class Form2
Const PI As Double = 3.141593
Const FREQ As Integer = 40
Const CLIP As Boolean = True
Dim XMIN As Double = -PI
Dim XMAX As Double = PI
Dim YMIN As Double = -PI
Dim YMAX As Double = PI
Dim ZMIN As Double = -PI
Dim ZMAX As Double = PI
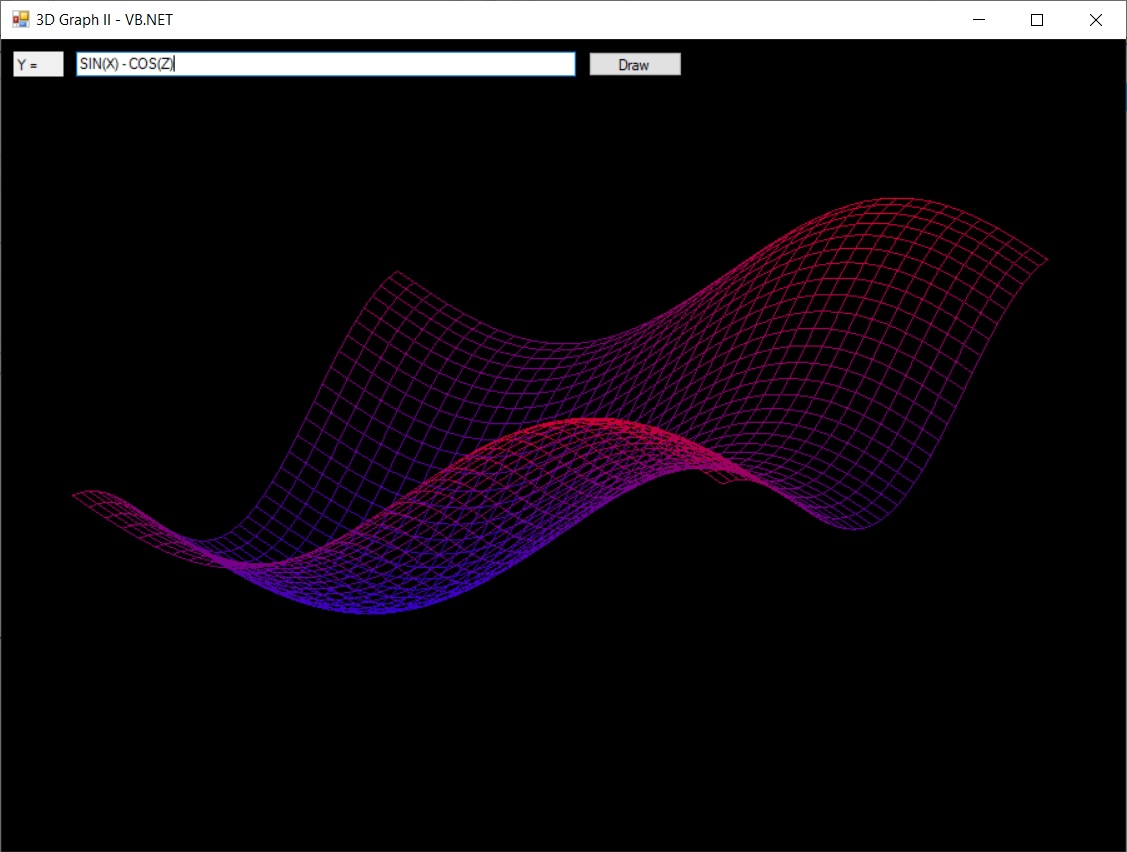
Dim equation As String = "SIN(X) - COS(Z)"
Dim LZX(FREQ) As Single
Dim LZY(FREQ) As Single
Dim compiledExpr As Func(Of Double, Double, Double)
Private Sub Form1_Load(sender As Object, e As EventArgs) Handles MyBase.Load
Me.Text = "3D Graph II - VB.NET"
Me.ClientSize = New Size(900, 650)
Me.Location = New Point(275, 75)
DoubleBuffered = True
Dim lbl As New Label With {.Text = "Y =", .Top = 10, .Left = 10, .Width = 40, .Height = 20, .TextAlign = ContentAlignment.MiddleLeft}
Dim box As New TextBox With {.Name = "EquationBox", .Text = equation, .Top = 10, .Left = 60, .Width = 400}
Dim btn As New Button With {.Text = "Draw", .Top = 10, .Left = 470, .Height = 20}
AddHandler btn.Click, Sub()
equation = box.Text
Try
compiledExpr = CompileExpression(equation)
Invalidate()
Catch ex As Exception
MessageBox.Show("Error compiling expression: " & ex.Message)
End Try
End Sub
Controls.AddRange({lbl, box, btn})
' Precompile once
compiledExpr = CompileExpression(equation)
End Sub
Private Sub Form1_Paint(sender As Object, e As PaintEventArgs) Handles Me.Paint
Dim bmp = New Bitmap(ClientSize.Width, ClientSize.Height)
Using g As Graphics = Graphics.FromImage(bmp)
g.SmoothingMode = Drawing2D.SmoothingMode.HighSpeed
g.Clear(Color.Black)
DrawGraph(g)
End Using
e.Graphics.DrawImage(bmp, 0, 0)
End Sub
' ---------- Drawing Functions ----------
Private Sub DrawGraph(g As Graphics)
' Define margins
Dim marginLeft As Integer = 50
Dim marginTop As Integer = 60
Dim marginRight As Integer = 50
Dim marginBottom As Integer = 40
Dim plotWidth As Integer = Me.ClientSize.Width - marginLeft - marginRight
Dim plotHeight As Integer = Me.ClientSize.Height - marginTop - marginBottom
' Logical bounds with buffer space
Dim XSMIN = XMIN - 0.25 * (XMAX - XMIN)
Dim XSMAX = XMAX + 0.25 * (XMAX - XMIN)
Dim YSMIN = YMIN - 0.25 * (YMAX - YMIN)
Dim YSMAX = YMAX + 0.25 * (YMAX - YMIN)
' Graphing loop
For z As Double = ZMAX To ZMIN Step -((ZMAX - ZMIN) / FREQ)
Dim q As Integer = 0
For x As Double = XMIN To XMAX Step (XMAX - XMIN) / FREQ
q += 1
Dim LX = LZX(q)
Dim LY = LZY(q)
LZX(q) = CSng(AdjustX(x, z))
Dim y As Double
Try
y = compiledExpr(x, z)
Catch
y = 0
End Try
If CLIP Then y = Math.Max(YMIN, Math.Min(YMAX, y))
LZY(q) = CSng(AdjustY(y, z))
If q = 1 Then
LZX(q - 1) = LZX(q)
LZY(q - 1) = LZY(q)
End If
Dim col As Color = ColorFromY(y)
Using p As New Pen(col)
g.DrawLine(p,
ToScreenX(LZX(q - 1), XSMIN, XSMAX, plotWidth, marginLeft),
ToScreenY(LZY(q - 1), YSMIN, YSMAX, plotHeight, marginTop),
ToScreenX(LZX(q), XSMIN, XSMAX, plotWidth, marginLeft),
ToScreenY(LZY(q), YSMIN, YSMAX, plotHeight, marginTop))
If z <> ZMAX Then
g.DrawLine(p,
ToScreenX(LX, XSMIN, XSMAX, plotWidth, marginLeft),
ToScreenY(LY, YSMIN, YSMAX, plotHeight, marginTop),
ToScreenX(LZX(q), XSMIN, XSMAX, plotWidth, marginLeft),
ToScreenY(LZY(q), YSMIN, YSMAX, plotHeight, marginTop))
End If
End Using
Next
Next
End Sub
' ---------- Helpers ----------
Private Function AdjustX(x As Double, z As Double) As Double
Return z * 0.5 + x
End Function
Private Function AdjustY(y As Double, z As Double) As Double
Return z * 0.5 + y
End Function
Private Function ToScreenX(x As Double, xmin As Double, xmax As Double, width As Integer, leftMargin As Integer) As Single
Return CSng((x - xmin) / (xmax - xmin) * width + leftMargin)
End Function
Private Function ToScreenY(y As Double, ymin As Double, ymax As Double, height As Integer, topMargin As Integer) As Single
Return CSng(topMargin + (1 - (y - ymin) / (ymax - ymin)) * height)
End Function
Private Function ColorFromY(y As Double) As Color
Dim factor = (y - YMIN) / (YMAX - YMIN)
factor = Math.Max(0, Math.Min(1, factor))
Return Color.FromArgb(255, CInt(255 * factor), 0, CInt(255 * (1 - factor)))
End Function
' ---------- Expression Compilation ----------
Private Function CompileExpression(expr As String) As Func(Of Double, Double, Double)
Dim code As String = expr.ToUpper().
Replace("SIN", "Math.Sin").
Replace("COS", "Math.Cos").
Replace("TAN", "Math.Tan").
Replace("ATN", "Math.Atan").
Replace("EXP", "Math.Exp").
Replace("LOG", "Math.Log").
Replace("SQR", "Math.Sqrt").
Replace("ABS", "Math.Abs").
Replace("INT", "Math.Floor").
Replace("SGN", "Math.Sign").
Replace("PI", PI.ToString()).
Replace("X", "{0}").
Replace("Z", "{1}")
Dim formatted = $"Return {String.Format(code, "x", "z")}"
Dim methodCode = $"
Imports System
Imports Microsoft.VisualBasic
Public Module DynamicExpr
Public Function Eval(x As Double, z As Double) As Double
{formatted}
End Function
End Module"
Dim provider = CodeDom.Compiler.CodeDomProvider.CreateProvider("VB")
Dim parms = New CodeDom.Compiler.CompilerParameters With {
.GenerateInMemory = True,
.GenerateExecutable = False
}
parms.ReferencedAssemblies.Add("System.dll")
Dim results = provider.CompileAssemblyFromSource(parms, methodCode)
If results.Errors.HasErrors Then
Throw New Exception("Syntax Error: " & results.Errors(0).ErrorText)
End If
Dim asm = results.CompiledAssembly
Dim mi = asm.GetType("DynamicExpr").GetMethod("Eval")
Return Function(x, z) CDbl(mi.Invoke(Nothing, New Object() {x, z}))
End Function
End Class
Download '3-dimensional Graphs':
📥 Download 3-dimensional-graphs.vb